I wrote this blog post shortly before the coronavirus pandemic and it didn’t seem like the right time to post it. But now knowing how much we are all at risk, I believe it is a good time to share the prevalence and incidence of diabetes. With no prevention or solid treatment for COVID19, we are among the most vulnerable. Our best strategy is to be as healthy as possible. Yet the isolation, lack of normal access to resources (gym, childcare, work, full grocery, hospitals, CDE, providers) can send stress levels soaring, which cause blood sugars to rise and burnout to escalate.
Diabetes care has never been more critical or more difficult. And we must do the best on our own. You know I focus on the mind/spirit challenges of diabetes. Without those pieces in place, care of the physical body is essentially impossible. If you are struggling, my online courses can help you with new coping skills, perspectives and ways to stay motivated. I have enacted discounted pricing so the course is affordable to everyone. Stay safe everyone and be well! PD
Original Blog
I am a numbers girl. Always have been. So, I thought we’d have some fun digging into the latest diabetes stats. According to the CDC’s 2020 Report on National Diabetes Statistics over 10% of the US population had diabetes as of 2018. That’s 1 in 10 of all of us. Look around, do you see 10 people? Everyone knows someone who has diabetes. As a former coworker of mine used to say, “that is not trivial”.
Methodology
The most curious thing I noticed was that the figures for people diagnosed with diabetes were “self-reported”, meaning that if a person said they had diabetes, that was all the proof they needed. For those they considered “pre-diabetes”, inclusion criteria were based on self-reporting of A1c and fasting lab reports of people who said they didn’t have diabetes. So basically, people self-reported lab values that indicated pre-diabetes, yet didn’t know they had pre-diabetes……head scratcher for sure.
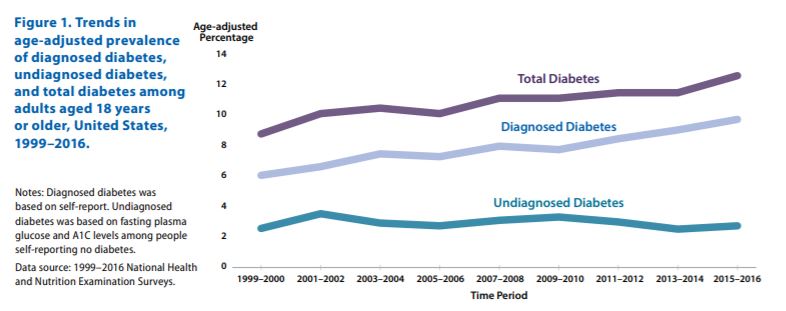
Diagnosed diabetes was based on self-report. Undiagnosed diabetes was based on fasting plasma glucose and A1C levels among people self-reporting no diabetes
I also had a hard time wrapping my head around the date ranges. Data appears to be collected in 2013-2016 with “crude estimates” for 2018 so what we know is based on data that is at least 4-year-old. With all the claims data we fill out for insurance claims, why isn’t that information used to paint a picture of diabetes in the US?? If insurance plans can “adjust” my premium rates because they know I have diabetes as of any given month, wouldn’t that data be worthy of reporting?? Just a thought.
Terminology
The report categorizes the statistics according to prevalence and incidence. Prevalence is defined by Merriam Webster as “the percentage of a population that is affected with a particular disease at a given time”. While incidence is defined as “the rate of occurrence or influence”. So, the prevalence of diabetes in the US is 10%, while the incidence is 1.5 million new cases per year as of 2017. No matter which way you slice and dice it, diabetes is rampant in the US.
Prevalence
The report has an abundance of statistics, but these were a few numbers I thought worthy of sharing. The numbers I am sharing below include those not diagnosed. To me they are in the same boat as the rest of us whether they know it or not, assuming that the elevated glucose levels will cause damage at some point. Just because you don’t have a diagnosis, doesn’t mean damage isn’t being done. That scares me!
- 10.5% of the US population had diabetes (all ages)
- 13.0% of all US adults had diabetes
- 26.8% of people over 65 years old had diabetes – 1 in 4 – OMG!!!
- While undiagnosed statistics remained rather flat, the prevalence of diagnosed diabetes continues to rise (see graph).

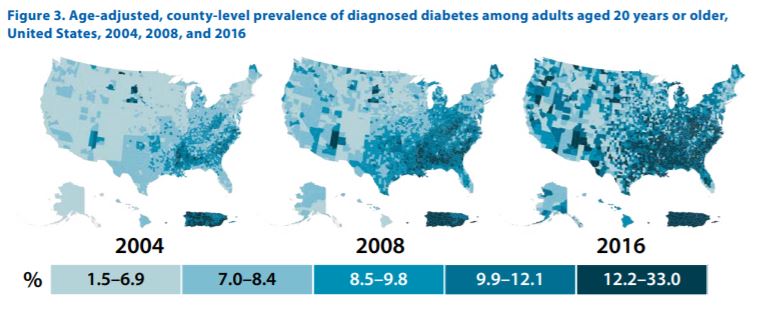
If those numbers aren’t enough to paint the picture, the following progression of the prevalence of diabetes from 2004-2016 illustrate the facts in graphic detail. Whatever we are doing to combat diabetes in the US isn’t working. At all. It is getting worse!

Incidence in Children and Teens
While the report shows some modest flattening of the incidence of new cases in adults, that is not the case for our younger citizens. Type 2 diabetes is on the rise in kiddos, especially black children. And that same group of kids are now showing higher incidence of Type 1 as well. That aqua line should scare us all. What the heck is going on?
(*A note on those adult number – we see the prevalence of diabetes increasing because the group “adults” spans many years, so all new cases add to the total number even though the incidence is less as fewer are diagnosed year to year.)

Impact
The total direct and indirect estimated costs of diagnosed diabetes in the United States in 2017 was $327 billion. Billion with a B! Based on this nifty website, with $327 billion dollars you could buy almost 11 MILLION cars! If you lived 327 billion minutes, you would be alive 622,146 years. It’s a lot!
And despite a lot of new treatments and technology, the medical costs per person have risen from $8,417 to $9,601 (not accounting for inflation, so it is actually higher!) This report from January of this year shows that all this money is not showing better outcomes. Neither do the CDC graphs!
Lifestyle considerations
Smoking, obesity, and lack of physical activity continue to be risk factors as are high blood pressure, high cholesterol and elevated A1c. These are also key findings in metabolic syndrome which I still believe is part of the chicken/egg conundrum. Why do some people get away with high risk choices and don’t get diabetes, but others try their best to make changes but have such a hard time?
In my years of clinical practice focus has always been on getting the numbers “in range”, which in theory is good, but to do that requires a LOT of lifestyle change. And this is where people struggle – making healthier lifestyle choices become lifelong habits. It is not breaking news that eating healthier, losing weight and exercising more offsets diabetes complications. You don’t have to have diabetes to benefit from living healthier, yet knowing this information is not enough. The graphs tell the story. If education were enough, the numbers would be going down!
Lasting Change
Willpower is not enough to make lasting changes, yet that is what is expected. People should just change because they know better. But we are a complex system of mind, body and spirit with many needs competing for our attention. Things like the need to fit in, the need to be comforted, the need to enjoy life’s pleasures, the need to avoid pain, the need to pursue ambitions, the need for autonomy and on and on. These “needs” compete with healthy choices sometimes and we “fail” to do diabetes perfectly.
The inevitable failures that come with diabetes can lead to burnout and feelings of “why bother?” which is a slippery slope into diabetes complications. So, with all the money and research why isn’t there something that works? There is.
Psychosocial Support
Studies going back over 15 years show improved diabetes outcomes:
- when people feel supported
- when they have more control and ownership of their bodies
- when they feel understood
- when their unique needs are addressed
- when they have adequate tools and training to manage stress
- when they feel empowered
These bullets show what psychosocial support looks like. Psychosocial support is about the wellbeing of your emotions, your relationships and your purpose in the world. When you feel better on those levels, you practice more self-care. Self-care reduces burnout and includes choices that make you healthier. And they are little choices overtime that become habits. A lack of self-care leads to burnout and neglect.
Perhaps diabetes treatment should start with strategies to prevent burnout and not just chasing numbers? Maybe then we’d see these graphs change??
It was the game changer for me…
Thanks for reading…. peace and be well,


0 Comments